LUALUALEI STATION
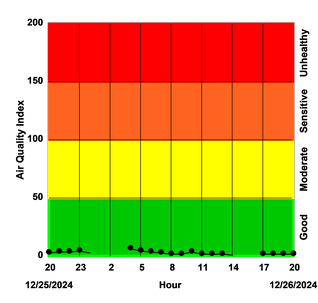
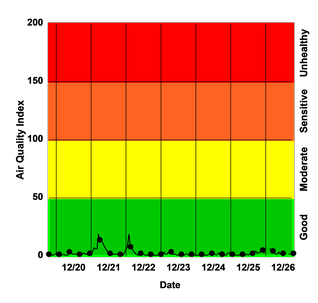
Nitrogen Dioxide (NO2) 1-Hour Air Quality Index (AQI) History
| Past 24 Hours |
Past 7 Days |
Past 30 Days |

|

|

|

|
In the charts above, all data points are
connected by a solid line. In the chart for the past 24 hours,
every data point is also indicated with a solid circle. In the chart
for the past 7 days, every 7th data point is indicated with a
solid circle. In the chart for the past 30 days, every 30th data point is indicated with a solid circle. |
[Home]
[SO2 1-Hr AQI]
[
Ozone 8-Hr AQI]
[
CO 8-Hr AQI]
[
PM10 24-Hr AQI]
[
PM2.5 24-Hr AQI]
[NO2 1-Hr AQI]
A DISCLAIMER: The data on this web
site are preliminary and await review and validation by qualified staff.
The data may be revised or invalidated after review. Every effort
is made to assert the validity and integrity of the real-time data
displayed on this web site, but data can be affected by equipment
malfunctions, technical difficulties and other unforeseen circumstances.


